
The unit of the chart.
The unit of the chart is the length of an equatorial mile expressed in millimetres.
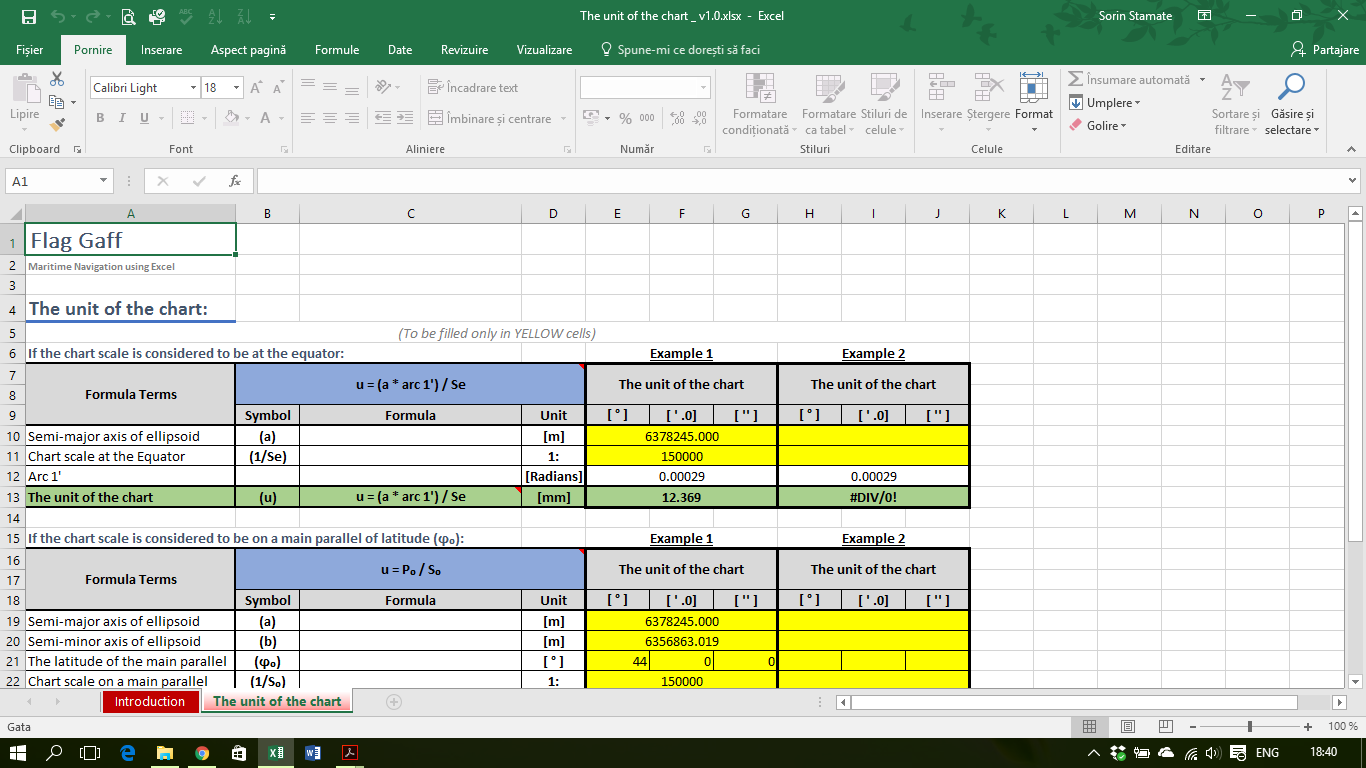
The basic element used to build a map in Mercator projection is the unit-of-the-chart.
The construction of a map in the Mercator projection begin with the calculation of this unit of the chart.
The unit-of-the-chart depends on the scale of the map, the scale that can be considered at the equator or on a certain parallel, called the main parallel.
Therefore, the unit-of-the-chart, when the scale is given for the main parallel, is equal to the ratio between the length of one minute of the main parallel (in millimetres) and the denominator of the chart scale.
The MS Excel file contains various examples that can be deleted and edited with your data.

To download this Excel file, please click the button below.